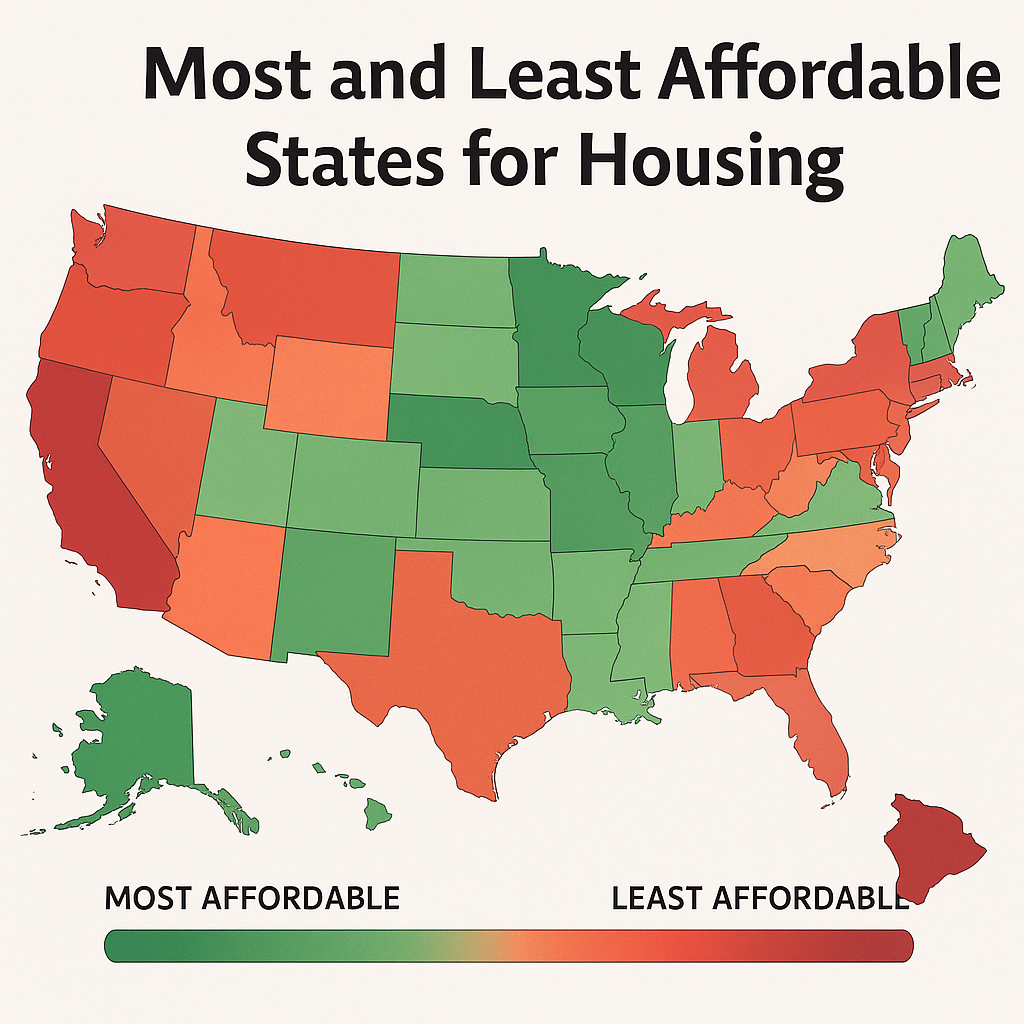
Housing affordability isn’t what it used to be—no surprise there. But according to a new analysis from Realtor.com, some states are still holding their own when it comes to the balance between home prices, income, and new construction. And a few names at the top of the list may surprise you.
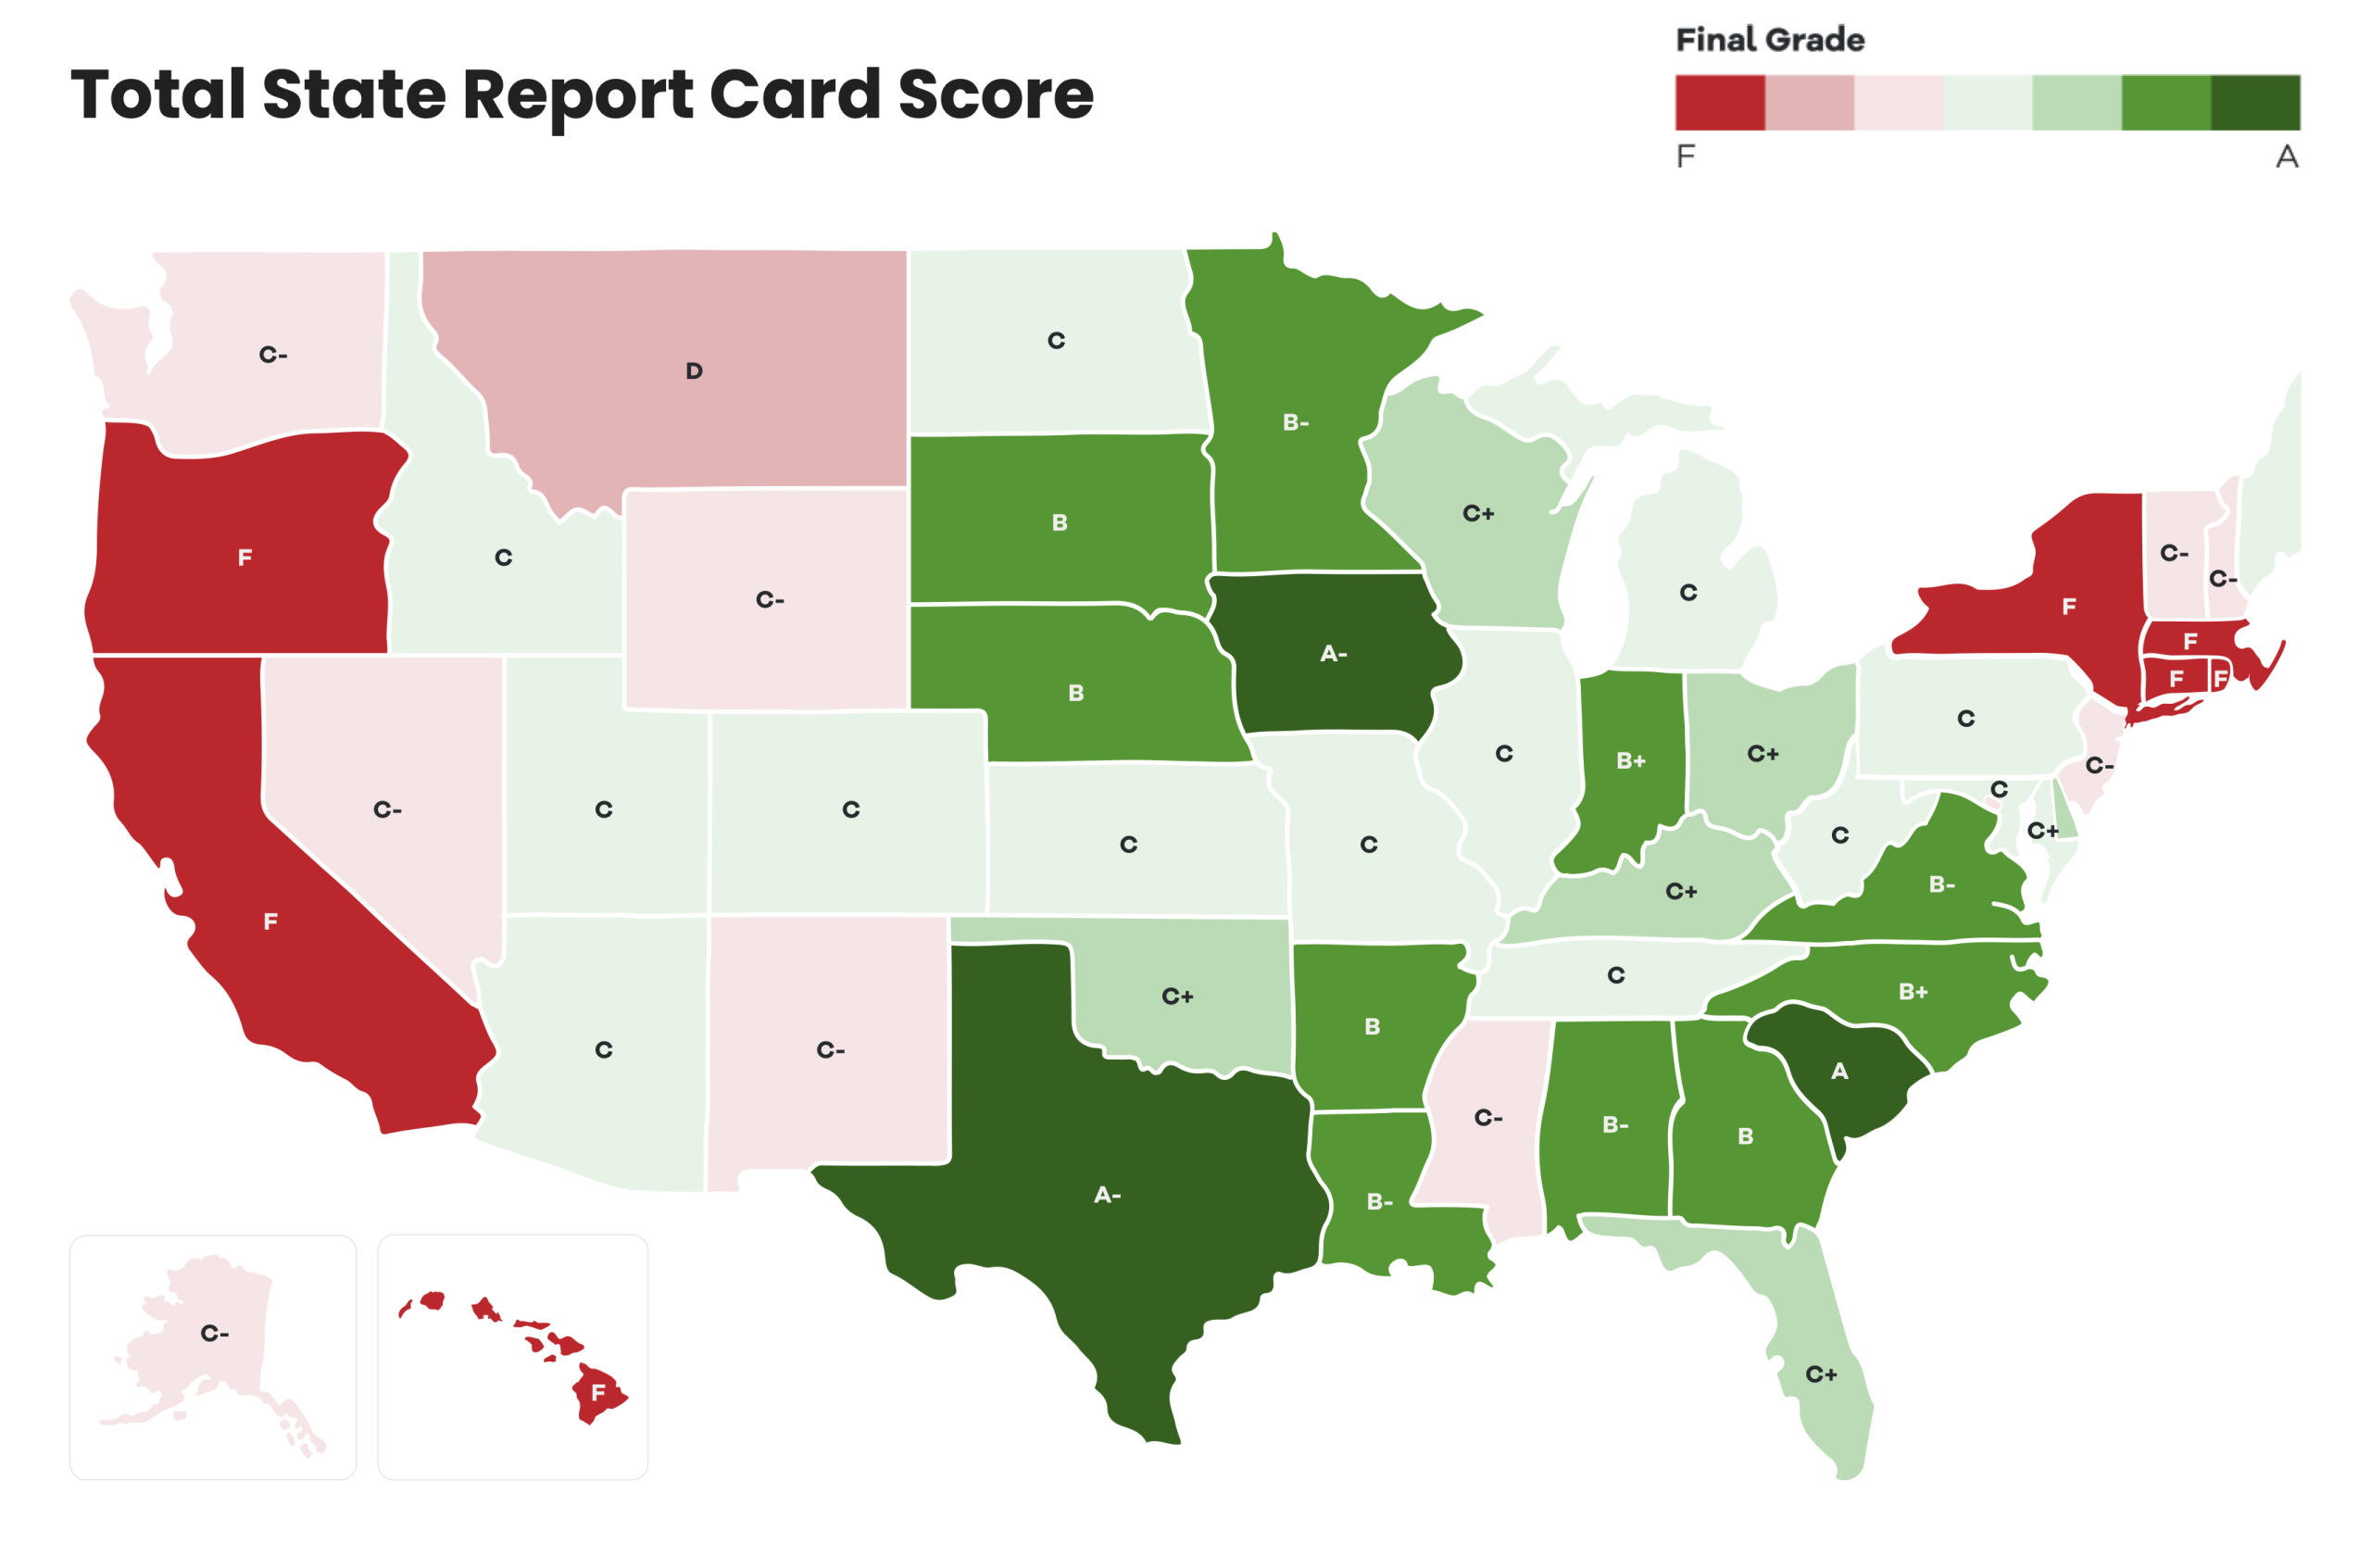
South Carolina snagged the top spot as the most affordable state in the country, earning an overall “A” with a relatively low median price ($354,429), reasonable income-to-price ratio, and—here’s the kicker—a negative new construction premium. That means new homes there are actually selling for less than existing ones, which is about as rare as a stress-free appraisal these days.
Iowa, Texas, Indiana, and North Carolina rounded out the top five. What most of these states have in common is a solid flow of new housing permits relative to their populations—an indicator that supply may (finally) be catching up to demand in some areas. Texas, for example, accounted for over 15% of all new home permits in the U.S. this year, despite only making up 9.2% of the population. That kind of building activity helps keep pressure off prices, even in a growing state.
On the other end of the spectrum, the bottom of the list features the usual suspects. California, Hawaii, New York, and Massachusetts all received failing grades, thanks to sky-high listing prices and stagnant construction. Rhode Island ranked dead last, with a total score of just 12.2 out of 100. In many of these states, incomes simply haven’t kept pace with housing costs, and the lack of new construction only makes it worse.
One interesting metric in the study is the “REALTORS® Affordability Score,” which attempts to capture how realistic it is for a typical household in each state to buy a home. Anything around 0.7 is considered decent. South Carolina, despite topping the rankings, came in at just 0.65—underscoring how tough the landscape is everywhere.
So, what’s the takeaway? If you’re advising clients on relocation or investing across state lines, this data offers a smart starting point. Affordability isn’t just about price—it’s about income, supply, and whether new homes are priced within reach. And in today’s market, that makes all the difference.
| Rank | State | Total Score | Grade | Affordability Score | Median Listing Price | Median Household Income | Share of 2024 Permits | Share of Population | New Construction Premium |
|---|---|---|---|---|---|---|---|---|---|
| 1 | South Carolina | 75.2 | A | 0.65 | $354,429 | $64,898 | 3.2% | 1.6% | -8.2% |
| 2 | Iowa | 71.6 | A- | 0.92 | $294,600 | $73,122 | 0.8% | 0.9% | 58.4% |
| 3 | Texas | 71.5 | A- | 0.61 | $370,663 | $73,203 | 15.3% | 9.2% | 7.5% |
| 4 | Indiana | 69.9 | B+ | 0.87 | $293,021 | $69,674 | 1.8% | 2.0% | 49.1% |
| 5 | North Carolina | 68.8 | B+ | 0.59 | $408,663 | $68,774 | 6.4% | 3.3% | 2.6% |
| 6 | South Dakota | 67.0 | B | 0.59 | $380,391 | $73,956 | 0.4% | 0.3% | 11.4% |
| 7 | Nebraska | 66.7 | B | 0.72 | $350,229 | $74,027 | 0.7% | 0.6% | 49.4% |
| 8 | Arkansas | 65.2 | B | 0.74 | $296,829 | $59,274 | 0.9% | 0.9% | 41.5% |
| 9 | Georgia | 64.7 | B | 0.64 | $392,678 | $72,877 | 4.6% | 3.3% | 15.2% |
| 10 | Minnesota | 62.0 | B- | 0.77 | $394,042 | $86,272 | 1.5% | 1.7% | 47.1% |
| 11 | Virginia | 61.5 | B- | 0.73 | $434,711 | $89,172 | 2.3% | 2.6% | 39.0% |
| 12 | Louisiana | 61.3 | B- | 0.77 | $278,215 | $58,060 | 1.0% | 1.4% | 11.4% |
| 13 | Alabama | 60.2 | B- | 0.71 | $328,950 | $60,578 | 1.4% | 1.5% | 16.7% |
| 14 | Florida | 59.4 | C+ | 0.52 | $445,826 | $69,226 | 11.8% | 6.8% | -4.0% |
| 15 | Oklahoma | 58.4 | C+ | 0.77 | $297,540 | $63,261 | 0.9% | 1.2% | 33.4% |
| 16 | Ohio | 58.2 | C+ | 0.89 | $269,130 | $68,488 | 2.1% | 3.5% | 91.1% |
| 16 | Wisconsin | 58.2 | C+ | 0.67 | $381,282 | $74,195 | 1.6% | 1.8% | 39.9% |
| 18 | Kentucky | 58.0 | C+ | 0.75 | $304,296 | $62,837 | 1.1% | 1.3% | 32.2% |
| 19 | Delaware | 57.5 | C+ | 0.58 | $491,463 | $76,379 | 0.5% | 0.3% | 29.6% |
| 20 | Kansas | 57.1 | C | 0.82 | $303,891 | $71,300 | 0.6% | 0.9% | 105.9% |
| 21 | Arizona | 56.5 | C | 0.50 | $499,982 | $74,483 | 4.0% | 2.3% | -2.7% |
| 22 | Missouri | 56.2 | C | 0.82 | $298,696 | $68,010 | 1.2% | 1.8% | 50.9% |
| 23 | Maryland | 55.1 | C | 0.81 | $416,558 | $97,364 | 1.2% | 1.8% | 50.9% |
| 24 | West Virginia | 54.7 | C | 0.91 | $240,954 | $58,432 | 0.3% | 0.5% | 62.8% |
| 25 | Tennessee | 53.1 | C | 0.55 | $433,987 | $66,631 | 3.1% | 2.1% | 15.3% |
| 26 | Idaho | 52.2 | C | 0.42 | $571,023 | $72,949 | 1.2% | 0.6% | -2.0% |
| 27 | Maine | 51.1 | C | 0.59 | $440,523 | $71,476 | 0.4% | 0.4% | 40.6% |
| 27 | Colorado | 51.1 | C | 0.55 | $599,104 | $90,555 | 2.2% | 1.8% | 5.3% |
| 29 | Utah | 51.0 | C | 0.49 | $602,230 | $88,438 | 1.6% | 1.0% | 9.3% |
| 30 | Illinois | 50.1 | C | 0.86 | $316,613 | $79,180 | 1.3% | 3.7% | 75.0% |
| 31 | Michigan | 50.0 | C | 0.86 | $284,762 | $69,042 | 1.5% | 3.0% | 96.4% |
| 32 | North Dakota | 49.0 | C | 0.73 | $359,034 | $73,489 | 0.2% | 0.2% | 45.4% |
| 33 | Pennsylvania | 48.3 | C | 0.82 | $306,740 | $74,466 | 1.6% | 3.8% | 89.9% |
| 34 | Nevada | 45.7 | C- | 0.49 | $492,789 | $71,942 | 1.4% | 1.0% | 19.2% |
| 35 | New Jersey | 45.4 | C- | 0.58 | $563,048 | $96,278 | 2.5% | 2.8% | 74.1% |
| 36 | Washington | 44.7 | C- | 0.51 | $636,445 | $93,297 | 2.6% | 2.3% | 18.3% |
| 37 | Mississippi | 44.2 | C- | 0.72 | $291,262 | $55,030 | 0.5% | 0.9% | 41.9% |
| 38 | New Mexico | 43.2 | C- | 0.57 | $392,571 | $61,656 | 0.5% | 0.6% | 2.4% |
| 39 | Vermont | 43.0 | C- | 0.56 | $493,716 | $79,794 | 0.2% | 0.2% | 51.5% |
| 40 | District of Columbia | 42.6 | C- | 0.67 | $610,723 | $98,916 | 0.1% | 0.2% | 0.2% |
| 41 | New Hampshire | 42.2 | C- | 0.57 | $572,784 | $94,929 | 0.3% | 0.4% | 38.7% |
| 42 | Wyoming | 41.2 | C- | 0.56 | $465,295 | $73,733 | 0.1% | 0.2% | 19.6% |
| 43 | Alaska | 40.4 | C- | 0.73 | $417,738 | $86,275 | 0.1% | 0.2% | 30.3% |
| 44 | Montana | 35.2 | D | 0.40 | $634,523 | $69,683 | 0.4% | 0.3% | 14.7% |
| 45 | Oregon | 29.8 | F | 0.46 | $563,896 | $78,022 | 1.0% | 1.3% | 2.0% |
| 46 | Connecticut | 28.3 | F | 0.64 | $517,849 | $89,717 | 0.4% | 1.1% | 68.2% |
| 47 | California | 19.5 | F | 0.43 | $756,185 | $92,605 | 6.8% | 11.7% | -7.1% |
| 48 | Hawaii | 15.8 | F | 0.45 | $822,065 | $91,385 | 0.2% | 0.4% | 26.2% |
| 49 | New York | 13.2 | F | 0.50 | $664,622 | $81,057 | 3.1% | 5.8% | 76.2% |
| 50 | Massachusetts | 12.6 | F | 0.48 | $781,758 | $96,584 | 1.0% | 2.1% | 42.8% |
| 51 | Rhode Island | 12.2 | F | 0.47 | $537,521 | $80,791 | 0.1% | 0.3% | 43.8% |
Housing Affordability Scorecard by State – Interactive Map
Click on map for live, interactive map