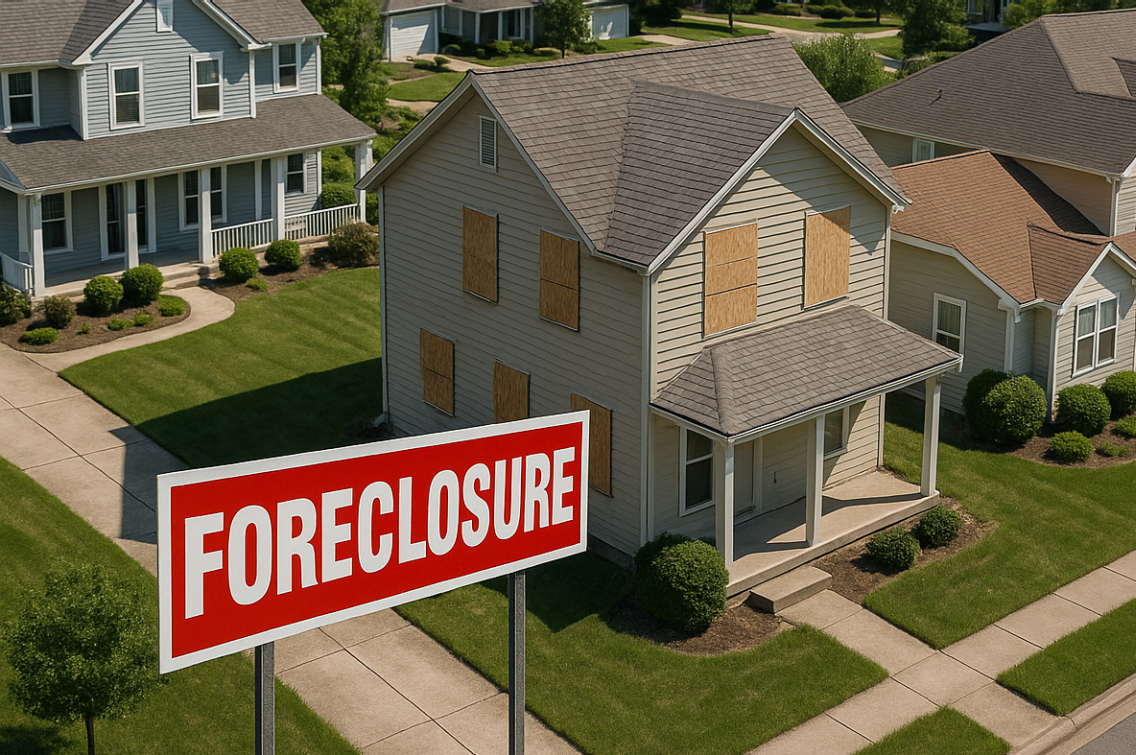
After declining sharply during the pandemic, foreclosure activity in the U.S. is continuing its slow but steady return to pre-COVID levels. According to ATTOM’s newly released April 2025 U.S. Foreclosure Market Report, foreclosure filings, including default notices, scheduled auctions, and bank repossessions, hit 36,033 nationwide last month. That’s a slight 0.4% uptick from March, but a more notable 13.9% increase from a year ago.
While that number still doesn’t come close to the monthly volumes we saw during the Great Recession, it’s the direction, and persistence, of the trend that’s worth watching. Rob Barber, CEO of ATTOM, summed it up plainly: “April’s foreclosure activity continued its gradual climb, with both starts and completions up annually… the year-over-year increases may suggest that some homeowners are beginning to feel the effects of persistent economic pressures”.
Breaking it down further, lenders started the foreclosure process on 25,265 properties in April, up 16.1% from April 2024. Completed foreclosures, or REOs, also jumped year-over-year, up 23.3% to 3,580 properties. While that’s actually a slight dip from March, it’s the second straight month with an annual increase, which makes it hard to ignore the pattern.
There’s some geographic variation worth noting. South Carolina, Illinois, and Florida posted the highest foreclosure rates in the nation last month. In South Carolina, one in every 2,311 housing units had a foreclosure filing, compared with a national average of one in every 3,950 units. At the metro level, Warner Robins, GA topped the list with one in every 1,512 homes receiving a filing.
Interestingly, while national REO numbers are up, some states are going in the opposite direction. South Carolina (despite its high foreclosure rate), Maryland, Ohio, New York, and New Jersey all saw double-digit declines in completed foreclosures compared to a year ago. So, even as distress returns to the market, it’s not doing so evenly.
In terms of volume, big metros like Chicago, Atlanta, New York, and Houston continue to lead in both foreclosure starts and REOs. That’s not surprising given their size, but it underscores how localized distress can get masked by national averages.
The bottom line? While the foreclosure landscape today looks nothing like the one that followed the 2008 crash, the pressure is building, albeit slowly. Whether it’s from rising consumer debt, softening home prices in some markets, or job market cooling, we’re seeing early signs of stress in the housing system. It’s not a wave yet, but it’s worth keeping an eye on.
Useful Resources for Real Estate Professionals & Investors
- Rental Property Calculator – Quickly analyze cash flow, cap rates, and ROI.
- Property Tax Rate Finder – Look up local property tax rates nationwide.
- FEMA Flood Maps – Check flood zone status and insurance requirements.
